[Open Source] Monitoring Visualization and Maintenance: A Consul-Based WEB Operations Platform for Elegant Management and Display

1. Project Overview
Houyi - TenSunS(Formerly ConsulManager) is a WEB-based operations management platform developed using Flask + Vue and built on Consul. It addresses the limitations of the official Consul UI in Services management. Based on Consul service discovery and key-value storage, it implements automatic Prometheus discovery of resources across multiple cloud providers, visual management of website monitoring based on Blackbox, and streamlined management and visualization of both self-hosted and cloud resources.
2. Open Source License
Licensed under the WTFPL open-source license.
3. Screenshots
Consul Web Manager Interface

Multi-Cloud ECS Synchronization with Consul Interface

Multi-Cloud ECS Synchronization with JumpServer Interface

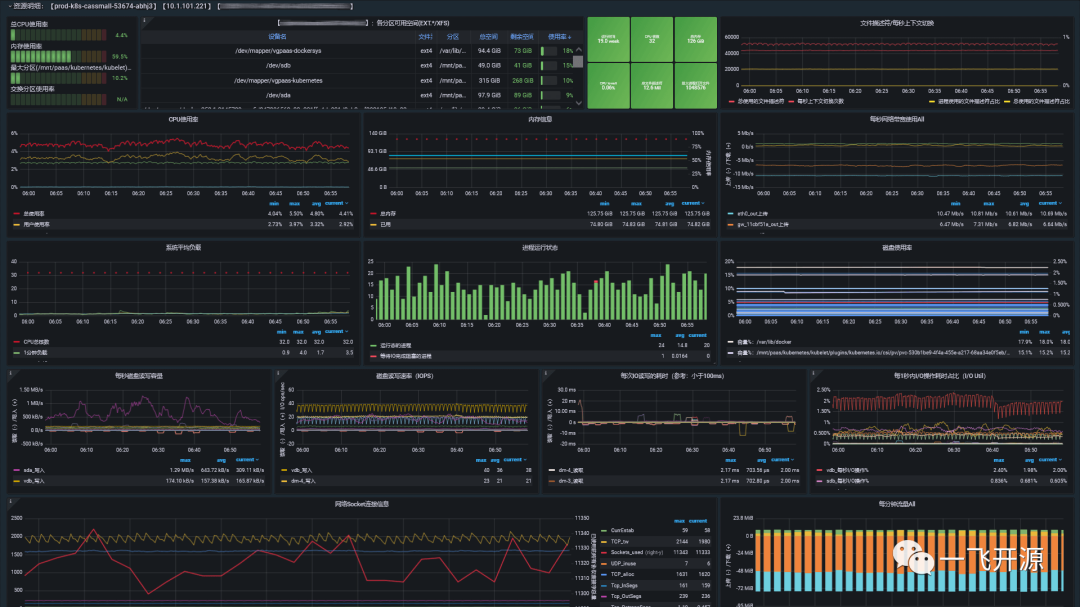
Node Exporter Dashboard Screenshot

Blackbox Manager Interface

Blackbox Exporter Dashboard Screenshot

High-Risk Vulnerability Collection and Notification Interface

DingTalk Alert Notifications

4. Feature Overview
Feature Description
1. Consul Management (A More Elegant Consul Web UI Than the Official Version)
- Supports CRUD operations for Consul Services, including batch deletion of Services.
- Intuitively view information about each Services instance and the overall health status of Services.
- Conveniently manage and query Tags, Meta, and health check configurations for Services instances.
2. Self-Hosted and Cloud Resource Monitoring and Management (ECS/RDS/Redis)
Uses Consul to enable automatic discovery of Prometheus monitoring targets.
- ✔Currently supports integration with Alibaba Cloud, Tencent Cloud, and Huawei Cloud.
- ⭐ Supports automatic synchronization of multi-cloud ECS/RDS/Redisresources, groups, and tagsto Consul and integration with Prometheus automatic discovery! (Also provides cloud resource information queries and customizable pages.)
- ⭐ Supports automatic synchronization of multi-cloud ECS information toJumpServer。
- ⭐ Supports multi-cloudaccount balancesand cloud resourceexpiration dateswith configurable threshold-based alert notifications.
- ⭐ Supports integration with Prometheus as an Exporter: After adding a ConsulManager JOB to Prometheus, it can collect certain MySQL/Redis metrics from cloud providers. (Addresses the issue that native Exporters cannot retrieve some cloud-hosted MySQL/Redis metrics.)
- ✔Supports self-hosted servers/MySQL/Rediswith WEB-based management, including CRUD operations, batch import and export, automatic synchronization to Consul, and integration with Prometheus monitoring!
- ✔ Provides on-demand generation of Prometheus configurations and alert rules for ECS/MySQL/Redis.
- ✔ Designed multiple Grafana dashboards for Node_Exporter, Mysqld_Exporter, and Redis_Exporter, supporting synchronization and displaying various fields.
3. Website and API Monitoring Management
Uses Consul + Prometheus + Blackbox_Exporter to enable automatic website discovery and monitoring.
- Manage monitoring targets through a web interface, including CRUD operations and hierarchical grouping and querying of websites.
- Supports batch deletion and batch import of monitoring targets, with real-time data synchronization to Consul.
- Provides Blackbox configurations, Prometheus configurations, and alert rules for Prometheus website monitoring.
- Designed a Blackbox_Exporter Grafana dashboard that supports displaying fields across different hierarchical groups.
4. High-Risk Vulnerability Collection and Real-Time Alerts
- Added high-risk vulnerability collection and real-time alert notification features.
- Once enabled, it collects a list of the latest 30 vulnerabilities.
- Collects vulnerabilities once per hour and immediately pushes newly discovered vulnerabilities to group bots.
- Supports notifications through WeCom, DingTalk, and Feishu group bots.
5. Tech Stack
Deployment Instructions
♨TenSunS can be updated by running docker-compose pull && docker-compose up -d in the directory containing docker-compose.yaml.
Added one-click deployment scripts based on docker/K8S and a standalone Consul deployment script. All installation scripts are placed in the install directory.
Installation Using docker-compose
- install/docker-compose/all_install.sh(Recommended):
- PrerequisitesThe server must have the following installed:docker and docker-compose
- One-Click Installation:curl -s https://starsl.cn/static/img/all_install.sh|sudo bash
- After running this script, docker-compose will be used to start TenSunS and Consul. The installation path is: /opt/tensuns
- After the script finishes running, usage instructions and an automatically generated login password will be displayed.Open your browser and log in to TenSunS right away. Start exploring!
- install/docker-compose/consul_install_only.sh Standalone Consul installation script
- install/docker-compose/tensuns_install_only.sh Standalone TenSunS installation script (Users who already have Consul installed can use this script.)
Installation Using K8S
- install/k8s/install.sh: After running the script, you will need to set a password for the admin user. Once execution is complete, YAML files for installing TenSunS and Consul will be generated. TenSunS is stateless and includes an initialization container that checks whether the connection to Consul is successful, so it is recommended to install Consul first. Consul uses a StatefulSet, so storage must be configured beforehand (volumeClaimTemplates). The default configuration example automatically provisions storage on Huawei Cloud. Please refer to it and make any necessary modifications. After installation, you can access TenSunS using the IP address of any K8S node and port 31026. The service name is tensuns.
note:
- For all installation methods, the Consul management token is generated automatically. You can find it in the Consul configuration file or in the TenSunS docker-compose configuration.
- If you have already deployed Consul, you can find consul_token and consul_url in the environment variable sections of the TenSunS docker-compose.yaml or K8S YAML file. Configure them with your Consul information. The admin_passwd environment variable specifies the password for the TenSunS admin account.
- For issues encountered during installation or use, as well as troubleshooting, please refer to: FAQ
Thanks to the great Flask, VUE, and vue-admin-template projects.
Flask is a lightweight Python web framework based on the Werkzeug WSGI toolkit and the Jinja2 template engine. Flask is licensed under the BSD License. Flask is also known as a "microframework" because it uses a simple core that can be extended with additional functionality through extensions. Flask does not include a default database or form validation tool. However, Flask retains the flexibility to add these features through Flask extensions, including ORM, form validation, file uploads, and various open authentication technologies.
Consulis aservice meshsolution that provides a fully featured control plane with service discovery, configuration, and segmentation capabilities. Each of these features can be used independently as needed or combined to build a completeservice mesh. Consul requires a data plane and supports both proxy-based and native integration models. Consul provides a simple built-in proxy so everything works out of the box, while also supporting third-party proxy integrations such asEnvoy. Watch the video below to learn more about Consul from Armon, co-founder of HashiCorp.
Prometheus is an open-source monitoring and alerting system based on a time-series database, particularly suitable for monitoring Kubernetes clusters. Prometheus works by periodically collecting the status of monitored components through the HTTP protocol. Any component can be integrated into monitoring as long as it provides the corresponding HTTP interface. No SDK or additional integration process is required. This approach is particularly suitable for monitoring virtualized environments such as VM, Docker, and Kubernetes. The HTTP interface that exposes monitored component information is called an exporter. Most commonly used components in internet companies already have exporters available, such as Varnish, Haproxy, Nginx, MySQL, and Linux system metrics (including disk, memory, CPU, network, and more).