*To make Area graph*
>link css file (areagraph.css) in head section of your html file.
>Add Div with any id in body of html.set margin(position) of div according to your pagehere it is "areagraph-wrapper" as it is shown in photo
>Add Google hosted Jquery File and plugin file in Body tag
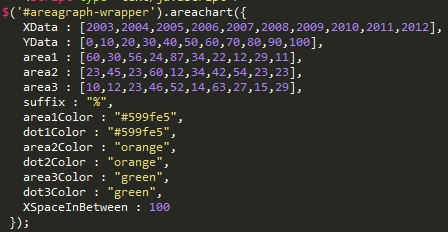
>Add plugin options to div
This areagraph plugin contains following options which you can access from outside.You don't need to change default options always.
There are total 3 area graph supported as you can see in image.blue one is named "area1".orange one is named "area2.And green one is named "area3"
The syntax is very similar to line graph to see any area graph front click on the dot of area graph
Require Plugin Options
*This options are necessary to plot graph*
XData: Data You can see on X-axis (2003,2004....2012 in above image).
YData: Data You can see on Y-axis (0%,10%....100% in above image).
area1:You have to just add data (blue lines in above image).
area2:You have to just add data (orange lines in above image).
area3:You have to just add data (Green lines in above image).
Advanced Plugin Options
*This options are additional functionality for plugin.You can use it if you wish.*
suffix:to add suffix in the end so you don't have to write for example "%" after every data (% in above image).Default is blank
prefix:to add prefix in the start so you don't have to write for example "$" after every data.Default is blank
area1color:to change color of area1.(default is blue) same with area2color: and area3color:
dot1color:to change color of dot1.(default is blue) same with dot2color: and dot3color:
XSpaceInBetween:Space between every XData after 2nd data as they share same space in between.Default is 100px
Use of full functionality is seen in below pic.
